Money Deal

  • Subscribe to our RSS feed.
  • Twitter
  • StumbleUpon
  • Reddit
  • Facebook
  • Digg
Showing posts with label nifty. Show all posts

Saturday, 3 December 2011

What does December hold for us?

Posted on 20:03 by Unknown
The markets returned their best weekly showing in 2.5 years to close at 5050, a net gain of about 7.2 pc. Are we out of the woods?Let us try and explore.

1. This stunning rally has been on the back of Domestic liquidity. DIIs have bought about 700 crores worth of shares whereas FIIs have sold to the tune of 110 crores. FIIs have sold for about 3 days of the 6 day rally.

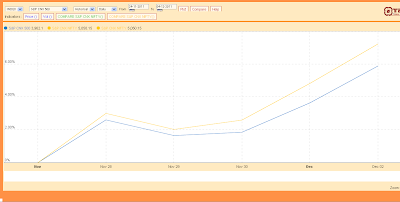
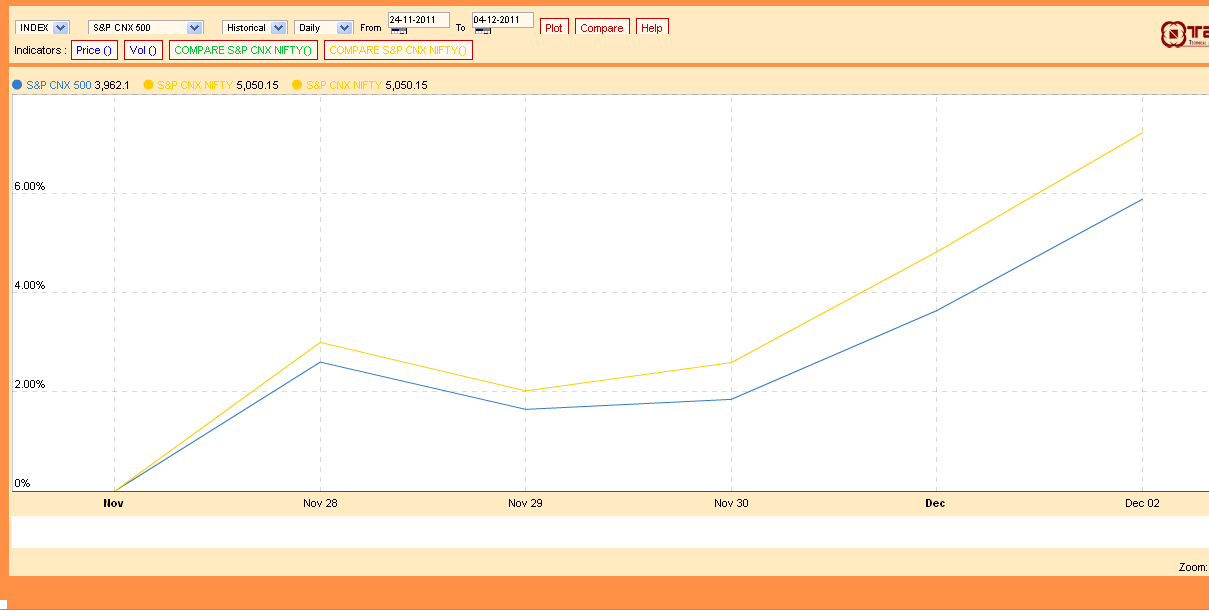
2. The Nifty has outperformed the broader market. The Nifty has gone about 7.2 % for the week whereas the broader CNX 500 has gone up by less than 6 %

3. The month of December has by and large been a very positive month for the equities. Since December 2002, the markets have always closed above the November close. This implies that this year if we go by history the markets should close above 4832. In all the years, the low for the month has always been below the previous month close. This implies that we should go down below 4832 at least once during the month.


4. If I try and project the average values, close should be around 5131, high at 5187 and low around 4731.

5. If we consider this up move as a retracement of the 5400-4639 fall then the next resistance to the up move comes at 5110.

6. In terms of number of sessions, the up move if it is an retracement should last for 6 to 10 sessions. 6 sessions are already over.

7. The logjam over FDI in retail will impact the markets negatively over the weekend. The next week should be either a flat or down kind of week.

For those interested in individual stocks or Gold, we have Lakshmi's Cherry Picks which are doing well.
Read More
Posted in december, investment cherry picks, nifty | No comments

Saturday, 19 November 2011

Chickens come Home to Roost

Posted on 21:43 by Unknown
The markets were down about 5 % to close the week at 4906. All the gloom and doom predictions are slowly coming true. In all this bad news lies the seeds of the next bull run. Lets see what the future holds for the Indian economy.


1. Kingfisher huge debts are threatening to derail the airline industry. Kingfisher going bust or requiring a bailout as serious implications not only for the airline sector but the banking Sector. The government is talking about FDI in Aviation. This comes a bit too late. Who will invest in India's ailing airline sector and even if they do it will be at throwaway valuations.

2. The Banks are threatened by NPAs. Not only Kingfisher debts but also from the Power Sector. The biggest one to take the hit is State Bank of India. The defaults have just started and things will get much worse before they improve.

3. The Government auctions of 10 year bonds are devolving on the primary dealers. In layman terminology this means that no one is willing to buy bonds from the government at the Interest Rates being offered. The last bond auction devolved at 8.83 %. The Repo Rate is at 8.5%. This pretty much makes the case for holding rates redundant. If the most secure asset in India gives you an yield of close to 9 %, the banks will demand much more from the home loans.

4. Over the last few weeks, ICICI Bank has stepped up bombarding people's mailboxes with offers of flats at sale at much discounted rates. This is another sign that the NPAs of banks in terms of real estate sector loans are beginning to show up. As the layoffs increase and the distressed sales increase, expect the Balance Sheets of Banks to look much more horrible.

5.The mid caps are being slaughtered in the markets. The ones which have large FCCB holdings and the companies where promoters have pledged shares are the ones being hammered. The Mid-Caps are already at a level of Sensex being 10000. Pipavav Defence is an example of being circuit down at Rs 55.

6. Technically, the markets may have made their low 4838 for this settlement. Every rise can be sold into. The supports come at the 4800-4850 band after which comes 4720 and then 4500. The markets are oversold now on a delay basis and some amount of bounce can come to take the market to 5000-5050 levels.

7. Europe continues to struggle with the debt crisis. A discussion with one of my colleagues from Germany underlined the same. The issue is ow how much should Germany support the rest of Europe. The future of Euro is in question and now it becomes a question of national politics rather than just being pure economics. The next year brings elections in France and the US. Germany goes to the polls in 2013.

8. Channel support comes at around 4830.First resistance now will come at 4950. These are small trading ranges and are suitable only for traders. The direction is now very clear and it is on the way down. Not all stocks bottom at the same time and this is a rare opportunity to build a new portfolio from a clean slate.

Amidst this boom and gloom now is the time to start picking stocks which will survive the downturn and will do well with a 3-5 year perspective.We must look for companies which have less amount of debt on the books, have a market for their products and ones which will represent the new India. For those interested in stock picks we have Lakshmi's Investment Cherry Picks.
Read More
Posted in nifty, NPAs, recession | No comments

Sunday, 30 October 2011

Markets: Have they given a breakout?

Posted on 01:42 by Unknown
It was a news filled truncated Diwali week. Diwali is over and now is the time to look ahead. Lets try and see what possible road the market takes ahead.

1. The RBI policy as expected hiked rates by 25 basis points. The fine print was that Savings Bank Interest Rates have been de-regulated. This has potential to erode the profit margins especially of large private banks. Yes Bank immediately offered 6 pc Interest rates on Savings Account. This is a drag on the private sector banks.

2. Europe crisis has been averted by the Private Banks taking a 50 pc haircut on their loans. If it was Greece alone, then crisis would have been averted. What happens when Italy and Spain default. Politically it is a master stroke by China. They have agreed to give funds but the first losses would be borne by the European governments. China's role as a World power has gone up several notches. This development heralds the shift of political power towards Asia. Earlier, China was an economic power, now political influence follows.

3. Our markets have filled the gap at 5350 - 5215 and this was broken by a gap up. This is also known as Island reversal provided there is follow up buying. We now run into a wall of resistances around 5400 - 5500 with 5470 being a key resistance on multiple parameters.

4. The crisis has not been solved, its only delayed. 5450-5500 also represents the trend line joining the tops from 6339. This should be taken out on a weekly basis, to herald a fresh bull market.

To Summarize, we are in a powerful bear market rally. Only a close above 5500 on a sustainable basis would foretell a fresh bull market. We are just 150 points away from a breakout. We wait and we watch on the sidelines.

For those interested in Stocks Picks and Gold, Lakshmi has her Investment Cherry Picks and Gold Rush on offer.
Read More
Posted in breakout, europe, nifty | No comments

Sunday, 23 October 2011

Markets: The Week Ahead

Posted on 10:21 by Unknown
It is a crucial week for the markets with the expiry on Tuesday and a curtailed trading week. TO complicate matters we have the RBI policy to boot on Tuesday. Let us see what the markets have to offer.

1. Expiry on Tuesday and RBI Credit policy on same day is potentially explosive cocktail. RBI should hike rates by 25 basis points. Anything less or more could trigger about 100 point moves on the Nifty.

2. The resistance of 5170 has held for 3 attempts now. Either we break it in the move or we tank to to test 4720. Above 5230, we can re-test the 5350-5400 zone.

3. If money is pumped in for Euro crisis and Greek gets a bailout, expect dollar index to go up, commodities to crash and gold to weaken in the short term.

4. One can look at investing in the Infrastructure Bonds of PFC covered in an earlier post.

5. The results are coming in and nothing spectacular to write home so far. The good results will be out and the ones declared later are usually nothing to write home about.

6. Infrastructure companies are bearing the brunt of the slowdown, like HCC and L&T.

I expect the markets to trade in a range in this truncated week. Have a safe, happy and prosperous Diwali.

Those interested in a package of Gold and Equity Picks investments can look at what Lakshmi has to offer.
Gold Rush and Investment Cherry Picks
Read More
Posted in gold, nifty | No comments

Sunday, 16 October 2011

Markets: The Week Ahead

Posted on 08:25 by Unknown
It was a rally on D-Street and the Nifty rallied about 5 pc to close the week at 5132. What will the coming week bring ahead. Will the rally continue or will it sputter. Let us try and find out.

1. The October Settlement is a truncated one. The expiry is happening on Tuesday, Oct 25th thanks to Diwali. This gives us about 7 sessions to expiry.

2. The RBI credit policy falls on Oct 25th. So, we will have action packed expiry this time. It will be like a lottery as a 100 point swings can happen.

3. The inflation is still not under control. I expect a 25 basis points hike the this policy meet.Interesting thing is that bond yields have moved significantly higher in the 8.7 - 8.8 pc band. This also implies that government borrowing is taking bond yields higher. Macros suggest a high interest regime to continue.

4. There are a slew of corporate results coming in this week. Usually the early results are the good ones. Reliance just about met expectations thanks to high refining margins,Infosys benefited from a weak rupee. The poorer results should come from the Banks (Treasury losses), Autos (poor sales) and Infrastructure companies.

5. The Nifty is moving towards the critical resistance of 5169 again. It has failed to move in past 2 attempts. After this we have the gaps from 5229 - 5331 to be closed. We are headed towards a cluster of resistances and it should be interesting to watch how the Nifty behaves at slightly higher levels.

6. This could be the 4th wave of C-3. refer earlier posts for exact wave counts. This wave can typically go up to 5350-5400 and then we have the last wave down which can last for 4 months.

7. The layoffs have started in financial institutions. The Petrol prices may be hiked again if the crude prices go up coupled with a weak rupee.

Do look at investing Infrastructure Bonds for tax savings. More in my guest post in Subhankar blog.

Tough times ahead and time to brace up.

Lakshmi has come up with a presentation on Gold to go with Equity Picks. I have helped her prepare both.
I am enclosing the link to her offer. I feel its a very attractive offer.
The Gold Rush starring Lakshmi Ramachandran
Read More
Posted in infrastructure bonds, nifty | No comments

Saturday, 3 September 2011

Technicals for the Week

Posted on 22:26 by Unknown
The markets closed up 6.2 pc for the week to end at 5040. Let us look at what is in store for the coming week.

1. We have a short term low in place as the market cleared the previous high of 4965 quite comfortably and closed above it for the past 2 days.

2. This means the down move from 5944 is in its 4th wave up. Retracement targets could be 5110 (already done), 5230 and 5350.

3. 4th Wave is in three legs A-B-C. A may be done at 5114. B could end at 4964, 4917 or 4870. Only a close below 4870 indicates weakness.

4. Gold continues to rise and we should see a rise till about 2200-2400 USD. Gold is buy on dips till it hits the targets

5. The Gilt funds have started giving a monthly return of about 1 pc for the past 2 months. Time to add more funds in the Gilt funds after the RBI Meet on September 16th. Hike of 25 basis points is factored in, but I would ot be surprised to see a 50 basis points hike looking at inflation and the GDP numbers.

6. Trend line support comes at 4955-4965 again underlining the significance of this level.

7. On the upside we run into resistances in 5180 - 5200 band. Immediate resistances come in at 5100-5120.

8. The Bollinger Bands give resistances at 5195 and 5350.

To sum it up, watch out for supports at 4965, 4920 and 4870 and resistances above 5100.

I am enclosing the link of Lakshmi for those who are interested in bottom fishing of stocks.
http://vipreetinvestments.blogspot.com/2011/09/wanna-shop-with-me_03.html
Read More
Posted in nifty, stock pick | No comments

Thursday, 1 September 2011

Stock Picking in the Downturn

Posted on 09:02 by Unknown
I keep getting queries which are the stocks to buy in this season of downturn. My friend Lakshmi whose Technical Analysis I love has come up with a shopping list. Have a look at her blog at below link:
http://vipreetinvestments.blogspot.com/2011/09/wanna-shop-with-me_02.html
Read More
Posted in nifty, stock | No comments

Saturday, 27 August 2011

Technicals for the Week

Posted on 23:30 by Unknown
The markets lost another 2 pc during the week to close at 4748. The picture is looking gloomy all round. What does the market bring for us the next week?

1. Anna Hazare fast is over and Ben Bernanke Jackson Hole meeting did not bring any nasty surprises. Expect some bounce next week.

2. The Elliot wave analysis states that we are in last down move of the 3rd wave down.
C wave so far.

Wave 1 - 5944 - 5196 = 748 points
Wave 2 - 5196 - 5741 = 545 points
Wave 3 - 5741 - 4796 = 945 points and ongoing
Wave 3 can be sub - divided into 5 waves
Wave 1 from 5744 - 5454 = 190 points
Wave 2 = 5454 - 5552 = 98 points
Wave 3 = 5552 - 4946 = 606 points
Wave 4 = 4946 - 5198 = 252 points
Wave 5 5198 - 4720 = 478 points and going on

Wave 3 has traversed a distance of 1024 points.If it extends to 138.2 pc of wave 1, target would be 4707.
If it extends to 161.8 pc then the target would be 4530 which is also near to the November 2009 bottom of 4538.

3. A bounce from these levels would last for 3-4 weeks and can go up to 5110, 5230 and 5350. Only a close above 5550 would signal a fresh bull run.

4. All bounces should be used to go short, Longs only above 4900 for short term trading.

5. The Weekly RSI is at a critical support area over the last 20 years. So, a bounce is due.

6. Trend line shows above 4867, the downward trend of this fall gets broken.


7. The 5 week low ema comes at 4959, a close above this shows end to the down move.

8. RBI may hike rates just 1 last time on September 16th. The next week is a truncated one and expect muted trading.

9. The Channel resistances come at 4881, 5038 and 5296.


Now, is the time to start preparing a shopping list and beginning to buy.
Read More
Posted in nifty, nifty channel, trendline | No comments

Sunday, 14 August 2011

Markets: What next?

Posted on 06:48 by Unknown
The markets lost a further 2.7 pc to close down at 5073. This is on the back of further negative news from Europe and US, a sharp spurt in Gold prices, good IIP numbers and FII selling.

1. The FIIs have sold almost 11000 crores this year ad 7000 crores in the first fortnight of August. The DIIs have picked up almost 20000 crores of shares this year and about 6000 crores in August. The market is down about 17 pc YTD. It is clear that the market dances on FII tunes. If the rupee weakens and the FIIs pull out cash, the market will go down.

2. Gold has given a breakout and is a buy on dips. As the currencies of the world weaken and the debt crisis increases, gold will go up.

3. SBI had a poor set of numbers. The NPAs are increasing and also the Rate Hikes look set to continue. Avoid the autos and the banks.

4. We had good IIP numbers and yet the markets fell. Why was this? This is because good growth means the RBI can hike the rates further to tame inflation and afford to sacrifice some growth.

5. Looking at the Elliot Waves, we are C wave from 5944

Wave 1 was 5944 - 5196 = 748 points
Wave 2 was 5196 - 5741 = 545 points
Wave 3 was 5741 - 4946 = 795 and ongoing.

Wave 3 should end this week and get set for a rally of about 450-500 points on the Nifty.

6. The band 4750 - 4900 has a confluence of supports and should hold for the present moment.

7. The gap area of 5204 to 5323 will act as a strong resistance. This gap getting filled up is the first sign of a bounce.

8. Open Interest points out to support at 5000 levels and resistance at 5200 and 5300 levels.

Strategy for the Week:
Historically for the past few months, the markets bounce towards end of expiry and hence cut shorts around the 5000 levels and be prepared for an expiry around the 5200 - 5300 levels.
Read More
Posted in debt crisis, europe, gold, nifty | No comments

Sunday, 31 July 2011

Game Changing Week possibly ahead

Posted on 00:59 by Unknown
The coming week is rife with multiple possibilities. The Deadline for US Debt deal is August 2nd and any delay out there could spell doom for the markets. Lets explore all possible Technical and Fundamental Factors.

1. I had a look at the Elliot Waves and they paint a somewhat bleak picture in the near term.

Assuming the rise from 2252 to 6339 was Wave 1 and Wave 2 started in November 2011.
Wave 2 will be sub divided into A, B and C.
Wave A was 6339 - 5177 = 1162 (November beginning to Feb beginning a period of 3 months)
Wave B was 5177 to 5944 (Feb beginning to April end a period of almost 3 months) and Wave C commenced from end of April.

C -1 was 5944 - 5196
C - 2 was 5196 - 5740
C -3 on going

If this is the case then C-3-2 will end soon and the dreaded C -3-3 will start with a massive gap down.

A Wave was about 1200 points so C can be 1200-1800 points giving targets of 4200 and 4800. This will be the buying opportunity of a life time.

2. India Infoline is coming up with Debentures offering up to 11.9 % interest per annum. A small exposure can be considered.

3. Gold is sustaining at new highs. In case of a sharp dip when debt deal gets announced, it would be a buying opportunity.

4. The 5500 - 5700 Range has been broken giving a target of 5300 as first target. 5400 would be a support area and shorts can be covered here and fresh shorts taken on bounces.

5. Event based trading is always difficult and one should always trade hedged.
Read More
Posted in elliot sensex, gold, india infoline, nifty | No comments

Saturday, 23 July 2011

Nifty: Technicals for the Week

Posted on 23:14 by Unknown
The Markets ended up 52 points on the Nifty thanks to a stupendous rally on Friday. The coming week is important because RBI policy announcement on Tuesday, then important Results to come, F&O expiry and then US Debt Crisis Resolution. Lets take a bird's eye view about the Technicals.

1. The Markets are still trapped in a range. I see a break out happening above 5700 or below 5500. Till then its a range bound market with a negative bias not withstanding the Friday rally.

2. We run into a the downward trend line joining the tops from 6339 at 5660. We need at least 3 closes above this to declare a breakout.

3. The 200 DMA comes in at 5718. There is a cluster of resistances from 5650-5720 to clear.
.

4. Let us look at Elliot Waves. Assuming,
Wave 1 was 6339 - 5177
Wave 2 A was 5177-5944
Wave 2 B was 5944- 5195
Wave 2 C can be till 5962
This is the alternate count.

Preferred Count is
Wave 1 6339- 5177,
Wave 2 5177-5944,
Wave 3 5944 - 5195 and ongoing which can be subdivided into
Wave 1 5944- 5195, Wave 2 ongoing. This count could be invalidated above 5944.

5. The Standard indicators are all in Downward momentum and its is an Option Writer's market.


6. Looking at fundamentals, I feel this is the last rate hike. Reason is growth is slowing down, Inflation is showing signs of being tamed.Also, I have been noticing that Banks have been very stingy in hiking Fixed Deposit Rates. This means that they expect Rates to come down within next 6 months. The Reverse Repo rate is already at previous highs. The Repo Rate last time went till 9 % and now is at 7.5 % so, we are approaching the end of Rate Hike cycle.

7. The entry into Gilt funds or NCDs of India Infoline at 11-11.5 % Rate of Interest is a good entry point now.

8. Gold has been very bullish and technically is looking awesome on the charts. Buy the dips and year end I feel we could see 1800-2000 dollars.

9. I am confident the Debt Ceiling will be raised soon and there could be an initial breakout or false breakout soon.

Trade hedged and trade light.Expect volatility the next week, and expect some big bang announcement next weekend.
Supports at 5500, Resistance at 5700
Read More
Posted in gold, nifty, rbi credit policy | No comments

Saturday, 28 August 2010

Nifty Tops and Difference from the Moving Averages

Posted on 21:12 by Unknown
Lets see the last few times when the nifty hit major tops and its behavior after that. Thanks to Natasha for suggesting this line of analysis.

1. Lets take the 20, 50, 100 and 200 MA and the distances by which they were above the Nifty in percentage terms when the markets hit the Tops. As each next top is hit, the out performance is steadily coming down. This implies that the rises are getting slower.


2. Next I took the falls after each rise. They have more or less have been same, slightly decreasing. Assuming that 5550 was a top, average of last 3 falls gives us a target of 4920. I would put a target in the range of 4920-4950.


3. Lets look at the channel we have been moving in for almost past 1 year. Logically, now that it has touched the upper end, the immediate target should be 4950-4980 in the next 5-6 weeks.

4. The interesting part comes after we come to the lower end of the channel at about 4950. The channel width is 600 points. If the bull run continues, the rise should continue. If the channel breaks, the next target comes at around 4350 this is also the bottom made in last August.

5. The FIIs have sold for last 3 days albeit small amounts. This is the first warning sign. Also, the A/D line has been going down. Very few stocks have been advancing to declining. Thanks to Lakshmi Ramchandran for the graph.


6. The condition for break of 20 EMA has been fulfilled as in the graph attached. Now, it should move up to the 20 EMA or slightly above and then fall. This should take us to 5460-5480 in the early part of the week before falling again.


To sum up, the Dow has just fallen away with no bounces. A sell-off in 9 out of last 12 sessions for no apparent reason. Its not as if any Bank has shut down, or European crisis. Gold has risen to almost all time highs (just about 20 dollars from its previous all-time highs). RIL has hit 950 a 52 week low when the Nifty is near its 52 week high.

All the above factors seem to make me just a wee bit uncomfortable.

Editor's Note: The above assumptions are invalidated if the channel broken upwards above 5550.
Read More
Posted in MA, nifty, nifty channel | No comments

Saturday, 3 April 2010

Nifty P/E and Dividend Yield

Posted on 23:28 by Unknown
This week lets look at 2 interesting ratios Price to Earning Ratio and the Dividend Yield of the Nifty. I have plotted the graphs from 1999-2010 taken from the NSE site.

1. Price - Earning Ratio.
This is nothing but the Market Price divided by the Earnings per Share or the Profits made by the company. This helps us identify how expensive the market is.
In the bubble peaks made by the market in 2000 and 2008, it had touched almost 28. In the bottoms made in Jan 04 and Mar 09 it was near 11 and Sept 01 around 12. Whenever the market has tumbled from P/E of 28 or rallied from 10-12 P/E it was a major top or bottom.


The market is currently around a P/E of 22.05. In Feb 01 when market tumbled from a P/E of around current levels it came to a P/E of around 13 again. On subsequent occasions it stopped its fall in a range from 12 to 15.
Now the EPS is Rs 234, after another 2 sets of quarterly results by July, assuming a gain of 6 pc, the eps should around Rs 250.
This gives a Nifty range between 3000 and 3750. This would coincide a retracement of 50 to 76 % of the rise. The figures would look speculative right now but the graph gives a perspective of P/E range.

2. Dividend Yield
Dividend yield is nothing but if we take dividend as a percentage of market price.High dividend yield means the stock price is low and vice-versa. This is inversely proportional to price of Nifty. When nifty is at highs, dividend yield is at lows and vice versa.


In 2000, the yield bottomed at 0.62, in 2008 at 0.88 and currently we are 0.93. Remember in 2000, we were in the dot com boom, hence IT stocks which give low dividend compared to price were at the top. For a dividend yield of 0.88, market would trade at around 5550 or 18500. We are not very far from that.
The yield tops out at 1.7 to 2. The dividend earning now is at 4919.Assuming a earning of Rs 5200 by the time we bottom out, Nifty would come to a range of around 3100

Both the above studies, simply indicate we may be near the top and give a range of the fall to follow.Of course, we could simply discard the 8 year cycle go on to make another peak at Nifty P/E of 28 translating to Nifty 7000 and then crash big time.

Lots to ponder about. Its your money, make informed decisions.
Read More
Posted in bottom, divided yield, nifty, P/E, Sensex, top | No comments

Tuesday, 30 March 2010

Interesting Chart from Vijay

Posted on 20:10 by Unknown

Here is what my friend sent.

Very Interesting, this implies a correction to 4950-5000 levels and then a final move up to 5350-5400.
Read More
Posted in gann, nifty | No comments

Friday, 22 January 2010

Markets: What to expect now?

Posted on 22:39 by Unknown

The last 2 days of the week were pretty bruising and we had a good amount of fall. The fall leads us to question , is the move just corrective or we are beginnig a fresh round of fall.

Points to consider:
1. FIIs have sold 3300 crores in last 3 days and DII have bought 2500 crores. Obviously attempts to hold up the markets.

2. The rally which began from 4944 to 5310 lasted from 21/12 to 06/01.9 days for up move and the down move has taken 12 days. This is a positive for the markets.

3. The trend line joining the lows from July as attached provided support on a weekly basis. This comes to 4972 for the next week. Also, we got support at 100 EMA.

4. The 5 week low EMA has been broken twice since March and once we crossed that previous 2 times we went much higher. This comes to 5051 for the next week. A close above that is positive for the markets.

5. The resistances would come now at 5051, 5110, 5179.

6. The US Markets fell on news of Obama trying to regulate the big banks. This dragged the world markets down. Lets see how this pans out because Obama is in a tight spot now with election losses. regulating big banks always appeals to public sentiment.

Strategy is simple, go long with hedges only if closes above 5051. Also, watch if 4944 breaks and closes below 4972 on weekly basis.

Next week is RBI policy on Jan 29th and NTPC opens its fresh offering on 3rd Feb. Expect supportive noises from the RBI, provided the world markets help.

I would continue to keep adding Gold to my portfolio.
Read More
Posted in gold, nifty | No comments

Saturday, 21 November 2009

How to play the upmove

Posted on 08:17 by Unknown


It was a Friday second half rally which took everyone by surprise. It looks like the previous high of 5182 for this calendar year could be taken out. So how do we play this upmove?


First there are several confirmations we need to wait for:

1. The fall from 5182 to 4539 was retraced in slower time than the fall. Retracement in slower time could mean that the rise was just a retracement to the fall. The pullback could be 80% of the fall in extreme cases, which in this case would be 5054 +- 30 points for whipsaws. We have already seen a high of 5079. The market corrected to 4933 (a weekly pivot). This fall was 27 pc of the up move from 4539.

2. The trend line joining the lows from 4539 comes to 5083 approx. The index needs to close above this for the uptrend to sustain. Weekly supports come around 5016-5022.

3. The 89% retracement comes to 5111. Beyond this level it is clear that this up move is more than just a retracement.

4. Reliance is 1 stock which has a record date of 1:1 bonus on 27th November. Typically stocks tend to move up after the ex-bonus date. This is also especially because of the perception in people's mind that the stock has become cheap. Reliance is currently trading at Rs 2125. If we look at the charts, it has broken the trend line joining the lows from Oct (Nifty 4539). If it moves up above 2150, it would also break the trend line joining the highs from October. Next would be a first target of Rs 2300.

5. Reliance formed a bullish engulfing pattern on the charts on Friday and also negating the highly bearish 3 black crow pattern.

4. Another advantage of playing Reliance is that if the market tanks, its a solid stock in one's portfolio.

5. The dollar index is strengthening. This could lead to FII unwinding. This needs to be watched. The next week is a shortened week in the US due to Thanksgiving. With our expiry on Thursday, the trend would be clear by Wednesday.

Happy Trading.
Read More
Posted in nifty, Reliance | No comments

Friday, 13 November 2009

Airport Developers: Niche Sector

Posted on 22:57 by Unknown
All throughout history, those cities have flourished which serve as a gateway to countries. The era of colonization may be over but the adage still hold true. London,Paris and Mumbai are just few examples where cities which have ports nearby have flourished.
Airports are the new gateways to the world. Every big city in India has just 1 airport or maybe in future to have 2 airports. Airports require lots of land and its a monopoly business.
I took a look at the major airports in India. GMR Infra has Delhi and Hyderabad airports under its belt. GVK Power had Mumbai and now a 12 pc stake in Bangalore airport.
The benefit of these 4 airports is that more than half of the nation's air traffic passes through these airports.
How do these folks make money?
1. Landing charges for aircraft, passenger fees which passengers pay when they take off from the airport.
2. Ground handling and baggage charges.
3.Non-Aero streams like rentals from shops, beverages, ATMs, car hire and airport amenities.
World wide about 70 pc revenues come from non - aero streams.

These operators have the airports on lease for about 50-60 years. I am particularly excited about Bangalore and Hyd airport because they are far away from the main city and the developers get huge parcels of land around the airport to develop for commercial use.

Remember 50 years back when current airports were built they too were on the outskirts of the city but now have become central airports.

Airports fall into the category of businesses which have high entry barriers. This is because no 2 airports can be built within a radius of 200 kms and current developer has first right of refusal.

The Noida airport has not taken off because of this same fact. The Navi Mumbai airport also will remain just on paper. This is because I have visited the site and seen for myself that lot of mangroves will get destroyed if they build the airport. This is precisely the reason it is stuck with the Environmental Ministry.
Even if the permission is given tomorrow, it will take at least 5 years for the airport to be operational.

Its difficult to find new investment ideas every day. This is 1 opportunity in front of us.

Next is valuations. That is as per individual appetite. These are real long term buys with great gestation periods. Both GMR and GVK are in power generation as well which would be hived off as separate companies.
Read More
Posted in airport developers, nifty, ports | No comments

Saturday, 31 October 2009

Is the upmove over?

Posted on 20:09 by Unknown
It was an action packed F&O expiry and a one way journey down. There are several interesting observations to be made which may suggest the entire rally from March 09 bottoms may be over.

1. The trend line joining the lows from March is broken decisively on weekly and daily basis.

2. The FIIs and DIIs were net net on the sidelines for the month of October. Both were almost net zero in terms of money pumped.
http://www.bseindia.com/mktlive/market_summ/categorywise_turnover.asp The BSE link from where I got the data.
This means that DII turned neutral to negative since August and now the FIIs have joined the same view. This makes November very critical.

3. Even though the market has corrected 7-8% from the tops, many stocks have lost much more, indicating a brutal market wide sell-off.

4. On the basis of 5 week Ema which comes to 4903, we have decisively broken it for the first time since March'09. This is the second weekly close below 5 week ema.

5. The 50 day ema was broken without much ado around 4850. The next support comes around 4600 odd levels.

6. The heartening thing to note was that both FII and DII were net buyers on Friday to the tune of 500 odd crores each. In spite of this the markets fell. Maybe a bear trap for shorters.

7. The Dow closed down 250 points on Monday nut it has also reached the oversold levels and a bounce is expected.

8. The RSI(14) is at 31. This is at lowest levels since March and in the oversold levels. A bounce ca be expected any month. Till 50 EMA is decisively taken out, I would use rallies to short.

9. The RBI credit policy with a hike of 100 basis points is a good step. RBI is ahead of the curve. Better pain now, that a bubble being created.

10. The US GDP growth of 3.5% is largely due to the cash for clunkers scheme and fiscal injections.

Conclusion: Those who have booked out, enjoy the fall and be ready to buy at lower levels. The rises can be used to get out. Those who have missed out the fall as a shorting opportunity, the first fall is always difficult to catch. I would wait for a confirmation of a second weekly close below 4900.
Read More
Posted in bounce, EMA, nifty, RSI | No comments

Saturday, 24 October 2009

Critical Week Ahead

Posted on 07:32 by Unknown
The markets hit a high of 5182 on the nifty before closing the week at 4997. This was a very interesting week, and the week that follows will tell us whether the entire rally which started from March is over or just a small dip. There were several differences this week over the previous 7 months.

First, the FIIs were huge sellers on last 3 days. They pulled out almost 1500 crores whereas DIIs pulled out 80 crores. I went back and checked. The DIIs have bee net sellers over August, Sept and Oct. In July they were marginal buyers.
This means the entire rally from July, post budget has been on FII flows. This week FII liquidation could be because of Galleon and Lehman forced liquidation or something else. If it was only a forced liquidation, then we should be ok.

Second, Nifty closed at 4997. The 5 week EMA was at 5000, and it has closed below it. This is only the second time in 7 months it has done so.Hence, for the bull run to continue we should close above 5000 next week. All the max open interest is at 5000 strike price for Oct expiry. So we should be somewhere around this by Thursday with a negative bias as there are more calls than puts written at 5000.

Thirdly, we have closed below 20 EMA from which we have taken support many times. 50 EMA comes at 4853 which becomes a key level to watch. Closing below this level for 3-4 sessions, then all bets are off.

UK recession continues. Longest recession since they started keeping records. In US, the corporate results were better than expected. The main thing is profits have increased but not the sales to the same extent. The increased profits come on the back of cost cutting measures. But you can cut costs only to an extent.

Lets see if the entire upmove from March is over and we begin the next leg of downmove or the uptrend is intact.

Over the longer term, I am bullish on sugar, gold and Telecom (Bharti).
Read More
Posted in EMA, gold, nifty | No comments

Thursday, 1 October 2009

P/E:An update

Posted on 21:31 by Unknown


The Nifty P/E is at 22.89 as of 01st October.

It has exceeded these levels only during the bubble crashes of 2000 and 2008. In 2004, it briefly flirted above this level before falling.

We have 2 scenarios now:
1. It keeps rising to about 28 creating a bubble like scenario. It would break the previous high or thereabouts and the a mega fall.

2. Correct from anywhere here to 5200 zone. Every time it corrects, it comes down to a P/E of 14-16 which would be equivalent to 3200-3600 range.

Right now, the liquidity is gushing with FIIs pumping in 1000 crores daily. I have not seen even in the earlier bull run.

We have the dollar carry trade like the yen carry trade with hedge funds borrowing at low interest rates in the US and leveraging these dollars in India.

These positions will be unwound when the dollar strengthens, (it would take more rupees to buy the same dollars invested) or interest rates rise in the US.

The dollex is showing some signs of rebound on Bernanke comments. Interest rates rising in US will take some more time.

Troubles in China or at home in US could reverse the flows.

Time not to invest aggressively and keep taking profits with trailing stop losses. I would keep a stop loss of 4900 for my investments.
Read More
Posted in FIIs, nifty, P/E, Sensex | No comments
Older Posts Home
Subscribe to: Posts (Atom)

Popular Posts

  • Has the Santa Rally started?
    The markets digested 2 events of the Central Banks of the US and the RBI coming out with policy pronouncements. Let us see what they mean fo...
  • Big Move Coming:Up or Down
    There is a big move coming in the markets this either up or down. There are several reasons why a big move would materialize. The person who...
  • PPF: Do Not Break that PPF amount just yet
    Its is that time of the year where one plans for tax savings.PPF is one of the best schemes for tax savings and planning for retirements. Th...
  • January: What does history tell us about January
    Taking into consideration how the market has fared in the last 12 January months, there are certain interesting observations one can come up...
  • Elections - The Trend Decider
    PFA the presentation for this month. I still believe: 1. This is a bear market rally. 2. We will go higher 12500 before elections is quite p...
  • Infosys disappoints and weak global cues
    The markets lost 2.2 % to close the week at 5207. The European cues and Infy results dragged the markets down. 1.Infosys results cannot be t...
  • Correction Continues
    The market continued its correction, dipping further by 1.4 pc. Let us try and examine the pros and cons of  the market movement. 1. The mar...
  • Election Results indicate a clear anti-Congress wave
    The ballots are counted and the victors have been declared. Who are the real winners and the losers? Are the election results a mirror to wh...
  • Asset Classes Review and Best Asset Class for 2013
    People usually have the options to invest in Equities, Real Estate, Gold, Debt funds. The idea of investing is either to make the maximum re...
  • World Markets Down: Why are we holding up?
    It was a tumultuous week for the World Markets. Europe, Shanghai and the US markets tanked. Indian Markets have fallen barely 3 pc from the ...

Categories

  • 3 Fans
  • airport developers
  • asset allocation
  • ayn rand
  • bailout
  • bollinger band
  • bottom
  • bounce
  • breakout
  • budget
  • china
  • compoundig
  • correction july results
  • covered call
  • debt
  • debt crisis
  • december
  • divided yield
  • dollar index
  • domestic consumption
  • double top
  • Dow
  • dubai
  • economic superpower
  • economy
  • elections
  • elliot sensex
  • EMA
  • europe
  • FIIs
  • financial planning
  • gann
  • GM. elections
  • gold
  • greece
  • hedge
  • hot money
  • idfc infrastructure bonds
  • india cabinet reshuffle
  • India growth story
  • india infoline
  • infrastructure
  • infrastructure bonds
  • Interest rates
  • investment cherry picks
  • January
  • MA
  • National Economic Debate
  • NCD
  • nifty
  • nifty channel
  • NPAs
  • Olympics
  • options
  • P/E
  • politics stocks market
  • ports
  • power
  • rally
  • rbi
  • rbi credit policy
  • recession
  • recovery
  • Reliance
  • repo
  • reverse repo
  • RSI
  • rupee
  • seasonality
  • Sensex
  • Sensex elections 2009
  • Shanghai
  • shorts
  • sovereign default
  • stock
  • stock pick
  • stocks
  • top
  • trading strategies
  • trendline

Blog Archive

  • ▼  2013 (57)
    • ▼  December (3)
      • Has the Santa Rally started?
      • Sell on News comes true
      • Election Results indicate a clear anti-Congress wave
    • ►  November (5)
    • ►  October (5)
    • ►  September (4)
    • ►  August (5)
    • ►  July (4)
    • ►  June (5)
    • ►  May (5)
    • ►  April (4)
    • ►  March (6)
    • ►  February (7)
    • ►  January (4)
  • ►  2012 (69)
    • ►  December (6)
    • ►  November (5)
    • ►  October (5)
    • ►  September (7)
    • ►  August (5)
    • ►  July (5)
    • ►  June (5)
    • ►  May (8)
    • ►  April (7)
    • ►  March (5)
    • ►  February (5)
    • ►  January (6)
  • ►  2011 (85)
    • ►  December (5)
    • ►  November (5)
    • ►  October (7)
    • ►  September (6)
    • ►  August (7)
    • ►  July (7)
    • ►  June (7)
    • ►  May (10)
    • ►  April (10)
    • ►  March (5)
    • ►  February (6)
    • ►  January (10)
  • ►  2010 (94)
    • ►  December (8)
    • ►  November (7)
    • ►  October (7)
    • ►  September (5)
    • ►  August (9)
    • ►  July (10)
    • ►  June (6)
    • ►  May (9)
    • ►  April (6)
    • ►  March (13)
    • ►  February (9)
    • ►  January (5)
  • ►  2009 (45)
    • ►  December (4)
    • ►  November (4)
    • ►  October (6)
    • ►  September (4)
    • ►  August (5)
    • ►  July (6)
    • ►  June (3)
    • ►  May (6)
    • ►  April (3)
    • ►  March (3)
    • ►  February (1)
Powered by Blogger.

About Me

Unknown
View my complete profile