Money Deal

  • Subscribe to our RSS feed.
  • Twitter
  • StumbleUpon
  • Reddit
  • Facebook
  • Digg
Showing posts with label elliot sensex. Show all posts

Sunday, 27 November 2011

Corrective Bounce Due

Posted on 05:46 by Unknown
The Markets fell about 4 pc to close at 4710 for the week. This was on the back of a 5 pc fall last week. The Markets are deeply oversold in the short term and are due for a bounce.

1. The markets have been falling hitting 5400. This is the 5th wave of the C wave which started from 5944
C1 ended at 5196
C2 ended at 5740
C3 ended at 4720
C4 ended at 5400

C5-1 ended at 4640 or should end soon. If C5-1 ended at 4640, C5-2 can go uptil 4930, 5020 or 5109.

2. Historically, the area from 4539 to 4700 has a cluster of supports and will not breakdown so very easily. A bounce of 400-500 points is very much on the cards.

3. The downward sloping channel shows supports at 4430 and resistance at 5320.


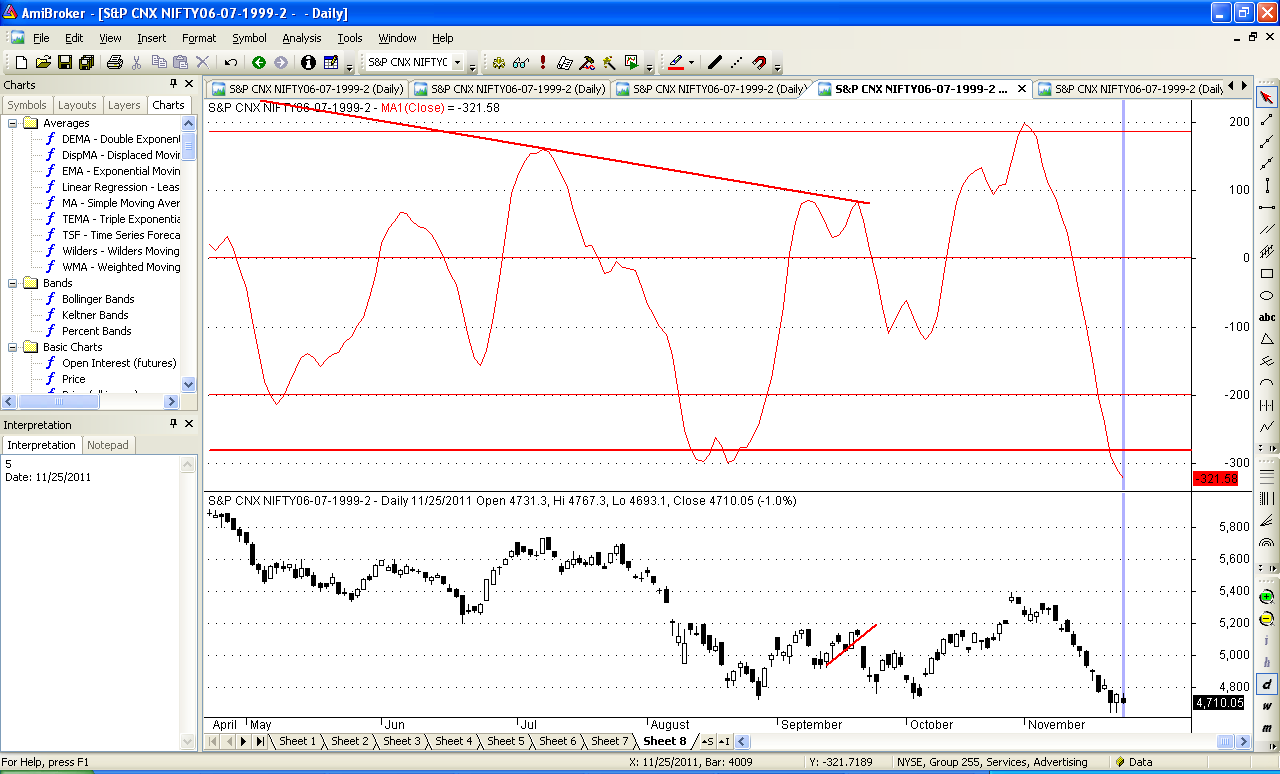
4. The difference between 5 day moving averages and the 20 day moving average has moved near historic support levels. This implies a bounce is due.


5. Historically, the month of December has always been a positive month with gains above 5 pc. Hence, the next week may be the last week of the fall at least in the short term.

To summarize, buy at supports 4640 and play for a bounce in the month of December. It is also time to start building a portfolio of blue chips and for those interested, we have Lakshmi's Cherry Picks.
Read More
Posted in elliot sensex, nifty channel | No comments

Sunday, 31 July 2011

Game Changing Week possibly ahead

Posted on 00:59 by Unknown
The coming week is rife with multiple possibilities. The Deadline for US Debt deal is August 2nd and any delay out there could spell doom for the markets. Lets explore all possible Technical and Fundamental Factors.

1. I had a look at the Elliot Waves and they paint a somewhat bleak picture in the near term.

Assuming the rise from 2252 to 6339 was Wave 1 and Wave 2 started in November 2011.
Wave 2 will be sub divided into A, B and C.
Wave A was 6339 - 5177 = 1162 (November beginning to Feb beginning a period of 3 months)
Wave B was 5177 to 5944 (Feb beginning to April end a period of almost 3 months) and Wave C commenced from end of April.

C -1 was 5944 - 5196
C - 2 was 5196 - 5740
C -3 on going

If this is the case then C-3-2 will end soon and the dreaded C -3-3 will start with a massive gap down.

A Wave was about 1200 points so C can be 1200-1800 points giving targets of 4200 and 4800. This will be the buying opportunity of a life time.

2. India Infoline is coming up with Debentures offering up to 11.9 % interest per annum. A small exposure can be considered.

3. Gold is sustaining at new highs. In case of a sharp dip when debt deal gets announced, it would be a buying opportunity.

4. The 5500 - 5700 Range has been broken giving a target of 5300 as first target. 5400 would be a support area and shorts can be covered here and fresh shorts taken on bounces.

5. Event based trading is always difficult and one should always trade hedged.
Read More
Posted in elliot sensex, gold, india infoline, nifty | No comments

Sunday, 27 September 2009

Liquidity Keeps Markets afloat

Posted on 06:03 by Unknown
Lets look at some of the stats for the month of September:

1. Nifty has been 6.34% up as compared to 31st august

2. FIIs have pumped in 10,854 crores in September and DIIs have put in 518 crores in September.

3.For the year from Jan'09, FIIs have put 16300 crores and DIIs have put 23535 crores.

The above Stats say a lot. Out of a total of about 40000 crores pumped in 9 months,11300 crores have come in September which amounts to roughly about 26 pc of inflows yet the market moves up only 300 points as compared to 2400 points from the bottom.

So now in spite of so much buying the market is not moving means someone is selling. The Smart Money is moving out of the Markets.

The FIIs display a herd mentality.Now, if this FII flow were to disappear then there would a stampede towards the exit doors.

The cheap dollar and low interest rates in the US are fueling this fascination for emerging markets. FIIs tend to churn the money around.

China down 18 pc from its peak value, Hong Kong about 4 pc and the Indian markets 1.58 % from the peak.

India story is looking good domestically, the only thing which can spoil the party is global triggers.

The Best option is to keep a trailing stop loss for positions at the 50 EMA which comes at 4658.
Read More
Posted in elliot sensex, EMA, nifty, Shanghai | No comments

Saturday, 23 May 2009

Elliot Waves and the Sensex

Posted on 09:33 by Unknown
This week I thought I would take a break from Fundamental Analysis and talk a bit about the Elliot Waves.

More about Elliot Waves can be learnt from www.elliotwave.com


What are Elliot Waves?

The Elliott Wave Principle is a detailed description of how groups of people behave. It reveals that mass psychology swings from pessimism to optimism and back in a natural sequence, creating specific and measurable patterns.

One of the easiest places to see the Elliott Wave Principle at work is in the financial markets, where changing investor psychology is recorded in the form of price movements. If you can identify repeating patterns in prices, and figure out where we are in those repeating patterns today, you can predict where we are going.

The Elliott Wave Principle is named for its discoverer, Ralph Nelson Elliott.

I have been fortunate to have interacted with Spandan Joshi, who is a Master of the Elliot Waves. I would like to acknowledge his immense support and enthusiasm in goading me to learn about Elliot.

The below analysis draws a great deal from his studies.


Elliot Waves are typically consisting of 5 waves, with 3 waves going in the upward directions and 2 waves retracting. Post this, there is a corrective A-B-C wave structure.

The corrective waves correspond to the Fibonacci retracement levels of 23.6 % or 38.2 % or 50 % or 61.8 % or 74 % or 89%.

The current bull run began in Sept 2001 at Sensex levels 2598 and the 5th wave ended in last Jan at 21206.


The corrective A-B-C structure began then onwards.

A and C would be downwards and B upwards.

A began 21206 and ended at 7797 in Oct'08.

B began at 7797 and would end at 38.2%, 50 % or 61.8% levels of the entire A wave.

Length of A = 13409 points.

B if = .382 = 12919

if = .5 = 14501

if = .618 = 16083 or higher.

We are currently in this B up move presently.

B again has 3 legs A, B and C, A and C upwards and B downwards.

B-A has been ongoing from 7797 and if we consider it to end at 14939 after elections then B- B would take us to 12157, 11368, 10526.

Post this we would see the final rally of B-C to maybe 14501 or 16083 levels.

Then the wave C would take up back to sub 10000 levels. Anywhere from 9500 to 5000 levels.

In a nutshell, we may rally upto 16000 before falling back to 5000-9000 levels on the Sensex.

Please note the Elliot targets appear fantastic, but events do happen which make those levels appear.

I didnt believe Spandan when he spoke 8000 levels when Sensex was at 17000.

Thanks,

Nishit


Read More
Posted in elliot sensex | No comments
Older Posts Home
Subscribe to: Posts (Atom)

Popular Posts

  • Has the Santa Rally started?
    The markets digested 2 events of the Central Banks of the US and the RBI coming out with policy pronouncements. Let us see what they mean fo...
  • Big Move Coming:Up or Down
    There is a big move coming in the markets this either up or down. There are several reasons why a big move would materialize. The person who...
  • PPF: Do Not Break that PPF amount just yet
    Its is that time of the year where one plans for tax savings.PPF is one of the best schemes for tax savings and planning for retirements. Th...
  • January: What does history tell us about January
    Taking into consideration how the market has fared in the last 12 January months, there are certain interesting observations one can come up...
  • Elections - The Trend Decider
    PFA the presentation for this month. I still believe: 1. This is a bear market rally. 2. We will go higher 12500 before elections is quite p...
  • Infosys disappoints and weak global cues
    The markets lost 2.2 % to close the week at 5207. The European cues and Infy results dragged the markets down. 1.Infosys results cannot be t...
  • Correction Continues
    The market continued its correction, dipping further by 1.4 pc. Let us try and examine the pros and cons of  the market movement. 1. The mar...
  • Election Results indicate a clear anti-Congress wave
    The ballots are counted and the victors have been declared. Who are the real winners and the losers? Are the election results a mirror to wh...
  • Asset Classes Review and Best Asset Class for 2013
    People usually have the options to invest in Equities, Real Estate, Gold, Debt funds. The idea of investing is either to make the maximum re...
  • World Markets Down: Why are we holding up?
    It was a tumultuous week for the World Markets. Europe, Shanghai and the US markets tanked. Indian Markets have fallen barely 3 pc from the ...

Categories

  • 3 Fans
  • airport developers
  • asset allocation
  • ayn rand
  • bailout
  • bollinger band
  • bottom
  • bounce
  • breakout
  • budget
  • china
  • compoundig
  • correction july results
  • covered call
  • debt
  • debt crisis
  • december
  • divided yield
  • dollar index
  • domestic consumption
  • double top
  • Dow
  • dubai
  • economic superpower
  • economy
  • elections
  • elliot sensex
  • EMA
  • europe
  • FIIs
  • financial planning
  • gann
  • GM. elections
  • gold
  • greece
  • hedge
  • hot money
  • idfc infrastructure bonds
  • india cabinet reshuffle
  • India growth story
  • india infoline
  • infrastructure
  • infrastructure bonds
  • Interest rates
  • investment cherry picks
  • January
  • MA
  • National Economic Debate
  • NCD
  • nifty
  • nifty channel
  • NPAs
  • Olympics
  • options
  • P/E
  • politics stocks market
  • ports
  • power
  • rally
  • rbi
  • rbi credit policy
  • recession
  • recovery
  • Reliance
  • repo
  • reverse repo
  • RSI
  • rupee
  • seasonality
  • Sensex
  • Sensex elections 2009
  • Shanghai
  • shorts
  • sovereign default
  • stock
  • stock pick
  • stocks
  • top
  • trading strategies
  • trendline

Blog Archive

  • ▼  2013 (57)
    • ▼  December (3)
      • Has the Santa Rally started?
      • Sell on News comes true
      • Election Results indicate a clear anti-Congress wave
    • ►  November (5)
    • ►  October (5)
    • ►  September (4)
    • ►  August (5)
    • ►  July (4)
    • ►  June (5)
    • ►  May (5)
    • ►  April (4)
    • ►  March (6)
    • ►  February (7)
    • ►  January (4)
  • ►  2012 (69)
    • ►  December (6)
    • ►  November (5)
    • ►  October (5)
    • ►  September (7)
    • ►  August (5)
    • ►  July (5)
    • ►  June (5)
    • ►  May (8)
    • ►  April (7)
    • ►  March (5)
    • ►  February (5)
    • ►  January (6)
  • ►  2011 (85)
    • ►  December (5)
    • ►  November (5)
    • ►  October (7)
    • ►  September (6)
    • ►  August (7)
    • ►  July (7)
    • ►  June (7)
    • ►  May (10)
    • ►  April (10)
    • ►  March (5)
    • ►  February (6)
    • ►  January (10)
  • ►  2010 (94)
    • ►  December (8)
    • ►  November (7)
    • ►  October (7)
    • ►  September (5)
    • ►  August (9)
    • ►  July (10)
    • ►  June (6)
    • ►  May (9)
    • ►  April (6)
    • ►  March (13)
    • ►  February (9)
    • ►  January (5)
  • ►  2009 (45)
    • ►  December (4)
    • ►  November (4)
    • ►  October (6)
    • ►  September (4)
    • ►  August (5)
    • ►  July (6)
    • ►  June (3)
    • ►  May (6)
    • ►  April (3)
    • ►  March (3)
    • ►  February (1)
Powered by Blogger.

About Me

Unknown
View my complete profile