
November has been a positive month for equity markets. The high has always been in positive terms. Max of 15 pc, min 2 pc and average of 8.8 pc. This gives us probable targets of (6920, 6139 and 6547)
The low points have varied from -13 pc to 0.21 pc. We can exclude -13 pc because we were in the midst of a bear market. Average has -2.8 pc giving us a potential low of 5845.
The close has been positive 8 times out of 10. Average close has 5.6 % higher than October. This gives us a target of 6355.
So now we have a potential low of 5845, high ranging from (6139, 6547, 6920) and a potential close of 6355.
It is a buy on dips market totally. Most money is made or lost in the last leg of bull market. Euphoria is needed for bull market to end. Coal India and Obama may give this much needed last fast rally.
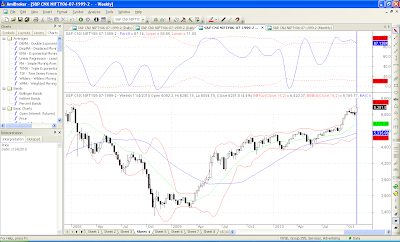
The Bollinger Bands on a weekly basis give us a target of 6420.

The monthly Bollinger band gives us an overbought picture last seen in Jan 2008. This gives us the possibility of a crash sooner or later.

Based on current evidence at disposal, recommendation is to be long with trailing stop losses as given in Daily Levels. Also, no writing of puts. Either buy calls or write calls.
Targets of 6422, 6547, 6920 are on the cards. On the lower side, 5540, 6017, 6142 are stop losses for longs.
I had done this analysis last week but forgotten to upload it. Taking this week into factor, keep 6000 as key level.Below 6000 down we go.


0 comments:
Post a Comment