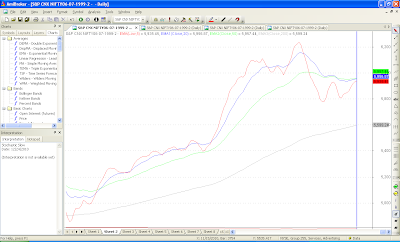
Its a long time since I did a study on purely technical analysis.Now, is a good time to focus on pure Technicals. Lets have a glance at e few charts below.
1. Lets look at at an indicator which Shail and I have did a study of. Its the difference between 5 DMA and 20 DMA of the Nifty. Right now it is in positive territory and touching the resistance line of the previous peaks. Any close above 6025 and this trend line gets broken upwards. A clear breakout.

2. The 50 DMA is at 6018. Have a look at the past record. Whenever it has been broken on the upside or downside, there has been a substantial move. This is the first time since the rally started in March 2009 that it is trying to make an up move after being resisted once. So, if we move convincingly above 6018, up we go else we are in for a major correction.

3. There is a cluster of supports around 5950. The 20 EMA, 50 EMA, 5 day low Ema. This values should be kept as strict stop losses on the lower side.

4. The Bollinger Band indicates a resistance around 6067 which was the previous top. This rally has been very slow and retracement has taken a longer time than the fall. All this makes the rally suspect.

5. In case of a fall, Gann fans indicate support around 5600 and resistance around 6600.

6. Considering Fibonacci levels, the resistances should be at 6047, 6070, 6106, 6215. Beyond 6215 we are going for new highs.
7. The daily stochs have given a sell signal. These are leading indicators. The correction can be up to 5950 or deeper levels.

Strategy in a nut shell, long above 6024 and short below 5950 levels. In between, just watch the fun.
1. Lets look at at an indicator which Shail and I have did a study of. Its the difference between 5 DMA and 20 DMA of the Nifty. Right now it is in positive territory and touching the resistance line of the previous peaks. Any close above 6025 and this trend line gets broken upwards. A clear breakout.

2. The 50 DMA is at 6018. Have a look at the past record. Whenever it has been broken on the upside or downside, there has been a substantial move. This is the first time since the rally started in March 2009 that it is trying to make an up move after being resisted once. So, if we move convincingly above 6018, up we go else we are in for a major correction.

3. There is a cluster of supports around 5950. The 20 EMA, 50 EMA, 5 day low Ema. This values should be kept as strict stop losses on the lower side.

4. The Bollinger Band indicates a resistance around 6067 which was the previous top. This rally has been very slow and retracement has taken a longer time than the fall. All this makes the rally suspect.

5. In case of a fall, Gann fans indicate support around 5600 and resistance around 6600.

6. Considering Fibonacci levels, the resistances should be at 6047, 6070, 6106, 6215. Beyond 6215 we are going for new highs.
7. The daily stochs have given a sell signal. These are leading indicators. The correction can be up to 5950 or deeper levels.

Strategy in a nut shell, long above 6024 and short below 5950 levels. In between, just watch the fun.


