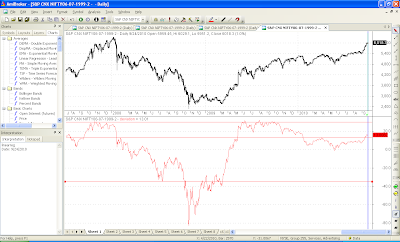
Markets tend to go through phases when they keep on going higher at a sustained rate or lower at a steady phase. They tend to deviate from their average prices of various periods like 20, 50, 100 and 200. Eventually they always come back to the average prices.
The genesis of this study came from SS who writes a very informative blog at http://timamo.blogspot.com/ which I love for its out of the box thinking. I have taken his study of 50 periods further and applied to 20, 50, 100 and 200 days moving averages.
1. 20 day average (5709)

The deviation is testing a resistance from where it has reversed many times. If it breaks this, we can look at 6850-7000 levels.
2. 50 day average (5549)

Much like the 20 MA deviation, here also we are at a critical resistance if we break this off we go to at least 6660-6700 levels.
3. 100 day average (5355)

Here too, if we break out of current trend line off we goto test 6600-6900 levels.
4. 200 day average (5236)

Here a small breakout is already visible giving us a target of 6800.
Bottom line to conclude is we have to follow the trend. If we break 6075-6100, all the previous resistances of deviation lines would be gone which could mean we march on to stratospheric levels. Levels of 6800 etc would put the P/E in bubble zone of 2000 and 2008 leading to very sharp cut. The averages themselves will provide supports on the downside.
Alternatively, we could reverse from here, give or take 100 points on the upside.
The genesis of this study came from SS who writes a very informative blog at http://timamo.blogspot.com/ which I love for its out of the box thinking. I have taken his study of 50 periods further and applied to 20, 50, 100 and 200 days moving averages.
1. 20 day average (5709)

The deviation is testing a resistance from where it has reversed many times. If it breaks this, we can look at 6850-7000 levels.
2. 50 day average (5549)

Much like the 20 MA deviation, here also we are at a critical resistance if we break this off we go to at least 6660-6700 levels.
3. 100 day average (5355)

Here too, if we break out of current trend line off we goto test 6600-6900 levels.
4. 200 day average (5236)

Here a small breakout is already visible giving us a target of 6800.
Bottom line to conclude is we have to follow the trend. If we break 6075-6100, all the previous resistances of deviation lines would be gone which could mean we march on to stratospheric levels. Levels of 6800 etc would put the P/E in bubble zone of 2000 and 2008 leading to very sharp cut. The averages themselves will provide supports on the downside.
Alternatively, we could reverse from here, give or take 100 points on the upside.


